Views: 0 Author: SEPPE Tech Publish Time: 2026-11-19 Origin: ABRASTECH REFRACTORIES FACTORY
Do you ever find yourself bewildered by complex particle size distribution curves and technical parameters?
Take a look at the laser particle size distribution chart for SEPPE CenoLite 910 below.
At first glance, you might frown:
"Blue bars, orange lines, and a whole bunch of numbers in microns..."
What exactly is this seemingly complicated chart for the CenoLite series telling us?
Let’s clarify a commonly misunderstood concept: what does "100-mesh" mean when referring to cenospheres?
In the context of cenospheres, "100-mesh" generally denotes a particle size grade defined by an 80-mesh sieve—for instance, requiring particles to pass through an 80-mesh screen.
In this scenario:
An 80-mesh sieve screens out particles larger than 150 μm,
while particles smaller than 150 μm pass through—which can include even finer particles, such as those that would pass through a 150-mesh or even 200-mesh screen.
Therefore, "100-mesh" does not mean that all particles concentrate around the 100-mesh size.
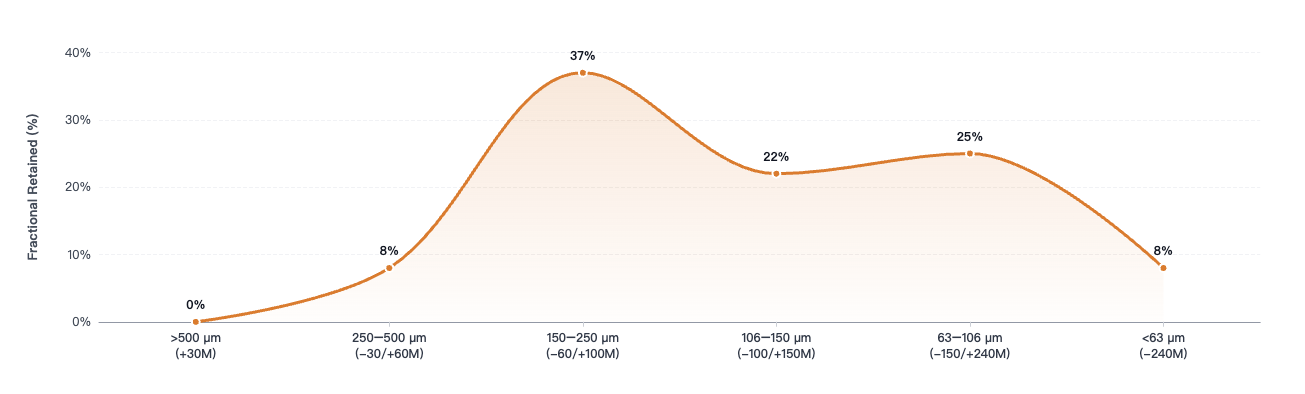
This chart uses a sieving method to categorize the product into distinct particle size ranges, showing the typical proportion for each.
SEPPE® CenoLite 8540 — Particle Size Distribution (Discrete Fractional). Click to view full size.
The data in the chart are as follows:
| Particle Size Range | Corresponding Sieve Range | Typical Proportion |
|---|---|---|
| > 500 μm | +30 Mesh | 0% |
| 250–500 μm | -30/+60 Mesh | 8% |
| 150–250 μm | -60/+100 Mesh | 37% |
| 106–150 μm | -100/+150 Mesh | 22% |
| 63–106 μm | -150/+240 Mesh | 25% |
| < 63 μm | -240 Mesh | 8% |
As the data show, the particles in CenoLite 8540 do not concentrate around a single mesh size; rather, they distribute across multiple particle size ranges. So, if we take 100 mesh (approximately 150 μm) as a screening threshold, how should we interpret this?
Particles larger than 150 μm: 45%
Particles smaller than 150 μm: 55%
In other words, according to this typical particle size distribution chart, approximately 55% of the CenoLite 8540 particles are smaller than the 100-mesh aperture size.
We measure particle size distribution using the laser diffraction method, in accordance with ISO 13320:2020.
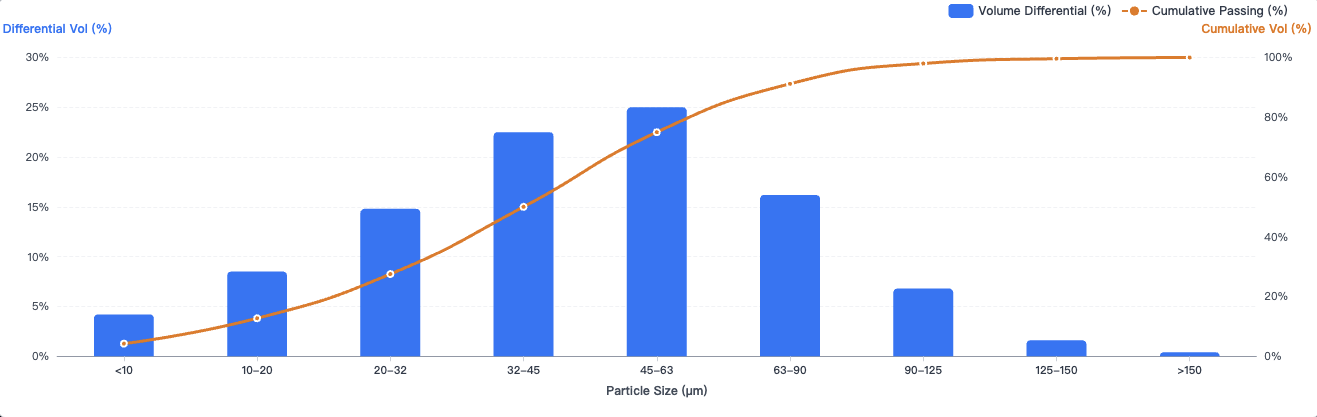
SEPPE® CenoLite 910 — Particle Size Distribution. Laser Diffraction (ISO 13320:2020) · D50: 45–60 μm · D98: ≤140 μm. Click to view full size.
Unlike the aforementioned sieving method, this chart displays both the volume fraction for each particle size range and the cumulative percentage passing.
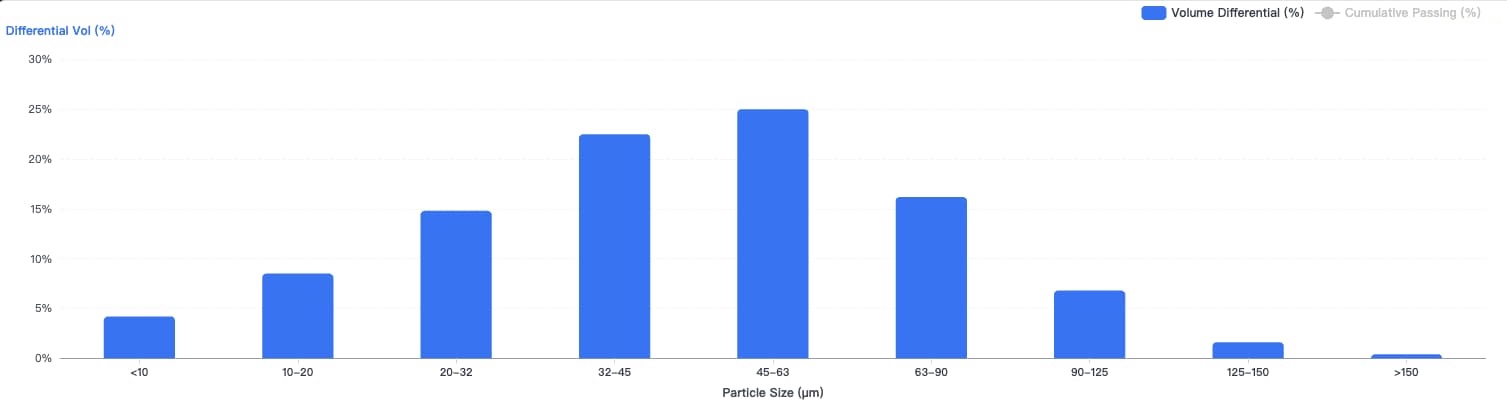
The blue bars show the volume fraction within each particle size range. Click to view full size.
The blue bars represent the volume distribution—that is, the proportion of the total volume that particles within each specific size range account for. The data in the chart are as follows:
| Particle Size Range | Volume Fraction (Blue Bars) | Cumulative Passing Rate |
|---|---|---|
| < 10 μm | 4.2% | 4.2% |
| 10–20 μm | 8.5% | 12.7% |
| 20–32 μm | 14.8% | 27.5% |
| 32–45 μm | 22.5% | 50.0% |
| 45–63 μm | 25.0% | 75.0% |
| 63–90 μm | 16.2% | 91.2% |
| 90–125 μm | 6.8% | 98.0% |
| 125–150 μm | 1.6% | 99.6% |
| > 150 μm | 0.4% | 100.0% |
According to the chart, 99.6% of the particles are smaller than 150 μm—a size that corresponds to the aperture of a 100-mesh sieve.
The volume distribution of this batch of cenospheres concentrates primarily in the 32–90 μm range.
(Note: The 45–63 μm range represents the largest volume fraction; this does not mean that 25 out of every 100 particles fall within this range.)
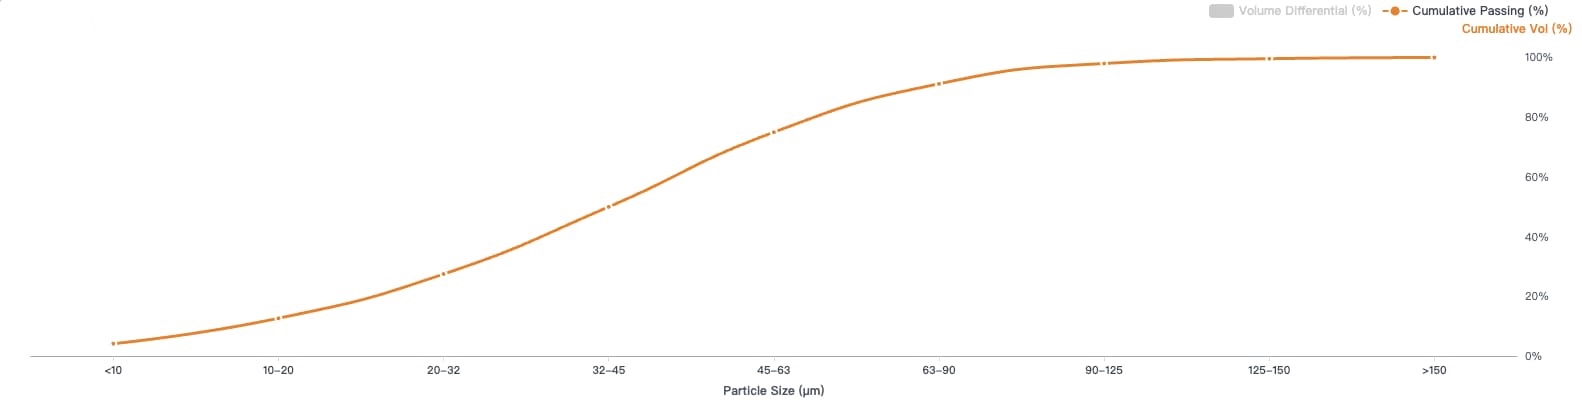
The orange curve shows the cumulative percentage passing below each particle size. Click to view full size.
The orange curve represents the cumulative passing rate, which we calculate by aggregating the data from the smallest particles to the largest. This tells us what proportion of particles can pass through a sieve with a specific aperture size:
| Upper Particle Size Limit | Cumulative Passing Percentage |
|---|---|
| 10 μm | 4.2% |
| 20 μm | 12.7% |
| 32 μm | 27.5% |
| 45 μm | 50.0% |
| 63 μm | 75.0% |
| 90 μm | 91.2% |
| 125 μm | 98.0% |
| 150 μm | 99.6% |
For example, 45 μm corresponds to 50%, meaning that approximately 50% of the particle volume consists of particles with a size of 45 μm or less. Similarly, 90 μm indicates that approximately 91.2% of the particle volume consists of particles no larger than 90 μm.
Let’s start with D50, also known as the median particle size—the particle size at which the cumulative passing percentage reaches 50%.
As the table shows, D50 = 45 μm.
A common misconception is that D50 represents the arithmetic mean of all particle diameters, or that most particles concentrate around the 45 μm mark.
In reality, it is simply a median value, indicating the point where the cumulative particle size distribution reaches 50%.
By looking at the D50 value, one can quickly gauge the overall particle size range of a product; it can even serve as a basis for preliminary screening or for discussing product specifications.
We can understand metrics like D10, D90, and D98 as observation points at different positions along the distribution, allowing us to gain insight into the finer or coarser fractions of the particles.
10% of the particle volume is below this size.
50% of the particle volume is below this size.
90% of the particle volume is below this size.
98% of the particle volume is below this size.
For instance, the particle size corresponding to a cumulative passing percentage of 98% provides information about the size range near the coarse end of the distribution. Similarly, if we consider a batch of cenospheres where D10 = 15 μm, this means that 10% of the total particle volume consists of particles smaller than 15 μm.
Does this make it easier to understand?
The blue bars represent the proportion of particles within each specific size range.
The orange line shows the cumulative volume of particles that fall below a given size.
D50 indicates the particle size at the 50% cumulative mark.
By presenting such a "complex" chart, SEPPE is certainly not trying to be obscure or unnecessarily complicate simple matters.
Our goal is to provide more comprehensive and transparent data, allowing customers to gain a true understanding of the product's actual characteristics.
When it comes to cenospheres, providing only a vague "mesh size range" is often insufficient to reflect the actual particle size distribution. Such a broad description can easily overlook the ratio of coarse to fine particles, the degree of distribution concentration, and potential variations between different batches.
Therefore, SEPPE chooses to disclose the raw, measured laser diffraction particle size data, rather than offering only a simplified specification range.
From the overall particle size distribution to the proportions within specific size intervals, we let the data speak for itself.
We believe that truly reliable quality should not remain limited to a few figures on a specification sheet; rather, authentic, complete, and verifiable test data must back it up.
Views: 0 Author: SEPPE Tech Publish Time: 2026-11-19 Origin: ABRASTECH REFRACTORIES FACTORY
Do you ever find yourself bewildered by complex particle size distribution curves and technical parameters?
Take a look at the laser particle size distribution chart for SEPPE CenoLite 910 below.
At first glance, you might frown:
"Blue bars, orange lines, and a whole bunch of numbers in microns..."
What exactly is this seemingly complicated chart for the CenoLite series telling us?
Let’s clarify a commonly misunderstood concept: what does "100-mesh" mean when referring to cenospheres?
In the context of cenospheres, "100-mesh" generally denotes a particle size grade defined by an 80-mesh sieve—for instance, requiring particles to pass through an 80-mesh screen.
In this scenario:
An 80-mesh sieve screens out particles larger than 150 μm,
while particles smaller than 150 μm pass through—which can include even finer particles, such as those that would pass through a 150-mesh or even 200-mesh screen.
Therefore, "100-mesh" does not mean that all particles concentrate around the 100-mesh size.
This chart uses a sieving method to categorize the product into distinct particle size ranges, showing the typical proportion for each.
SEPPE® CenoLite 8540 — Particle Size Distribution (Discrete Fractional). Click to view full size.
The data in the chart are as follows:
| Particle Size Range | Corresponding Sieve Range | Typical Proportion |
|---|---|---|
| > 500 μm | +30 Mesh | 0% |
| 250–500 μm | -30/+60 Mesh | 8% |
| 150–250 μm | -60/+100 Mesh | 37% |
| 106–150 μm | -100/+150 Mesh | 22% |
| 63–106 μm | -150/+240 Mesh | 25% |
| < 63 μm | -240 Mesh | 8% |
As the data show, the particles in CenoLite 8540 do not concentrate around a single mesh size; rather, they distribute across multiple particle size ranges. So, if we take 100 mesh (approximately 150 μm) as a screening threshold, how should we interpret this?
Particles larger than 150 μm: 45%
Particles smaller than 150 μm: 55%
In other words, according to this typical particle size distribution chart, approximately 55% of the CenoLite 8540 particles are smaller than the 100-mesh aperture size.
We measure particle size distribution using the laser diffraction method, in accordance with ISO 13320:2020.
SEPPE® CenoLite 910 — Particle Size Distribution. Laser Diffraction (ISO 13320:2020) · D50: 45–60 μm · D98: ≤140 μm. Click to view full size.
Unlike the aforementioned sieving method, this chart displays both the volume fraction for each particle size range and the cumulative percentage passing.
The blue bars show the volume fraction within each particle size range. Click to view full size.
The blue bars represent the volume distribution—that is, the proportion of the total volume that particles within each specific size range account for. The data in the chart are as follows:
| Particle Size Range | Volume Fraction (Blue Bars) | Cumulative Passing Rate |
|---|---|---|
| < 10 μm | 4.2% | 4.2% |
| 10–20 μm | 8.5% | 12.7% |
| 20–32 μm | 14.8% | 27.5% |
| 32–45 μm | 22.5% | 50.0% |
| 45–63 μm | 25.0% | 75.0% |
| 63–90 μm | 16.2% | 91.2% |
| 90–125 μm | 6.8% | 98.0% |
| 125–150 μm | 1.6% | 99.6% |
| > 150 μm | 0.4% | 100.0% |
According to the chart, 99.6% of the particles are smaller than 150 μm—a size that corresponds to the aperture of a 100-mesh sieve.
The volume distribution of this batch of cenospheres concentrates primarily in the 32–90 μm range.
(Note: The 45–63 μm range represents the largest volume fraction; this does not mean that 25 out of every 100 particles fall within this range.)
The orange curve shows the cumulative percentage passing below each particle size. Click to view full size.
The orange curve represents the cumulative passing rate, which we calculate by aggregating the data from the smallest particles to the largest. This tells us what proportion of particles can pass through a sieve with a specific aperture size:
| Upper Particle Size Limit | Cumulative Passing Percentage |
|---|---|
| 10 μm | 4.2% |
| 20 μm | 12.7% |
| 32 μm | 27.5% |
| 45 μm | 50.0% |
| 63 μm | 75.0% |
| 90 μm | 91.2% |
| 125 μm | 98.0% |
| 150 μm | 99.6% |
For example, 45 μm corresponds to 50%, meaning that approximately 50% of the particle volume consists of particles with a size of 45 μm or less. Similarly, 90 μm indicates that approximately 91.2% of the particle volume consists of particles no larger than 90 μm.
Let’s start with D50, also known as the median particle size—the particle size at which the cumulative passing percentage reaches 50%.
As the table shows, D50 = 45 μm.
A common misconception is that D50 represents the arithmetic mean of all particle diameters, or that most particles concentrate around the 45 μm mark.
In reality, it is simply a median value, indicating the point where the cumulative particle size distribution reaches 50%.
By looking at the D50 value, one can quickly gauge the overall particle size range of a product; it can even serve as a basis for preliminary screening or for discussing product specifications.
We can understand metrics like D10, D90, and D98 as observation points at different positions along the distribution, allowing us to gain insight into the finer or coarser fractions of the particles.
10% of the particle volume is below this size.
50% of the particle volume is below this size.
90% of the particle volume is below this size.
98% of the particle volume is below this size.
For instance, the particle size corresponding to a cumulative passing percentage of 98% provides information about the size range near the coarse end of the distribution. Similarly, if we consider a batch of cenospheres where D10 = 15 μm, this means that 10% of the total particle volume consists of particles smaller than 15 μm.
Does this make it easier to understand?
The blue bars represent the proportion of particles within each specific size range.
The orange line shows the cumulative volume of particles that fall below a given size.
D50 indicates the particle size at the 50% cumulative mark.
By presenting such a "complex" chart, SEPPE is certainly not trying to be obscure or unnecessarily complicate simple matters.
Our goal is to provide more comprehensive and transparent data, allowing customers to gain a true understanding of the product's actual characteristics.
When it comes to cenospheres, providing only a vague "mesh size range" is often insufficient to reflect the actual particle size distribution. Such a broad description can easily overlook the ratio of coarse to fine particles, the degree of distribution concentration, and potential variations between different batches.
Therefore, SEPPE chooses to disclose the raw, measured laser diffraction particle size data, rather than offering only a simplified specification range.
From the overall particle size distribution to the proportions within specific size intervals, we let the data speak for itself.
We believe that truly reliable quality should not remain limited to a few figures on a specification sheet; rather, authentic, complete, and verifiable test data must back it up.